Analysis Guide
Overview
FINDVIZ offers several analysis tools to help you explore patterns in your fMRI data. This guide explains the available analysis methods and how to use them effectively.
Table of Contents
Analysis Methods
Time Point Distance
The Time Point Distance tool calculates the similarity or distance between a selected time point and all other time points in your fMRI data. This analysis helps identify repeating patterns, state transitions, and temporal structure in your data. The distance is computed using whole-brain activity patterns, allowing you to see when similar brain states occur throughout the scan.
Available Distance Metrics
- Euclidean
- Squared Euclidean
- Cosine
- City Block
- Correlation
Distance Plot Options
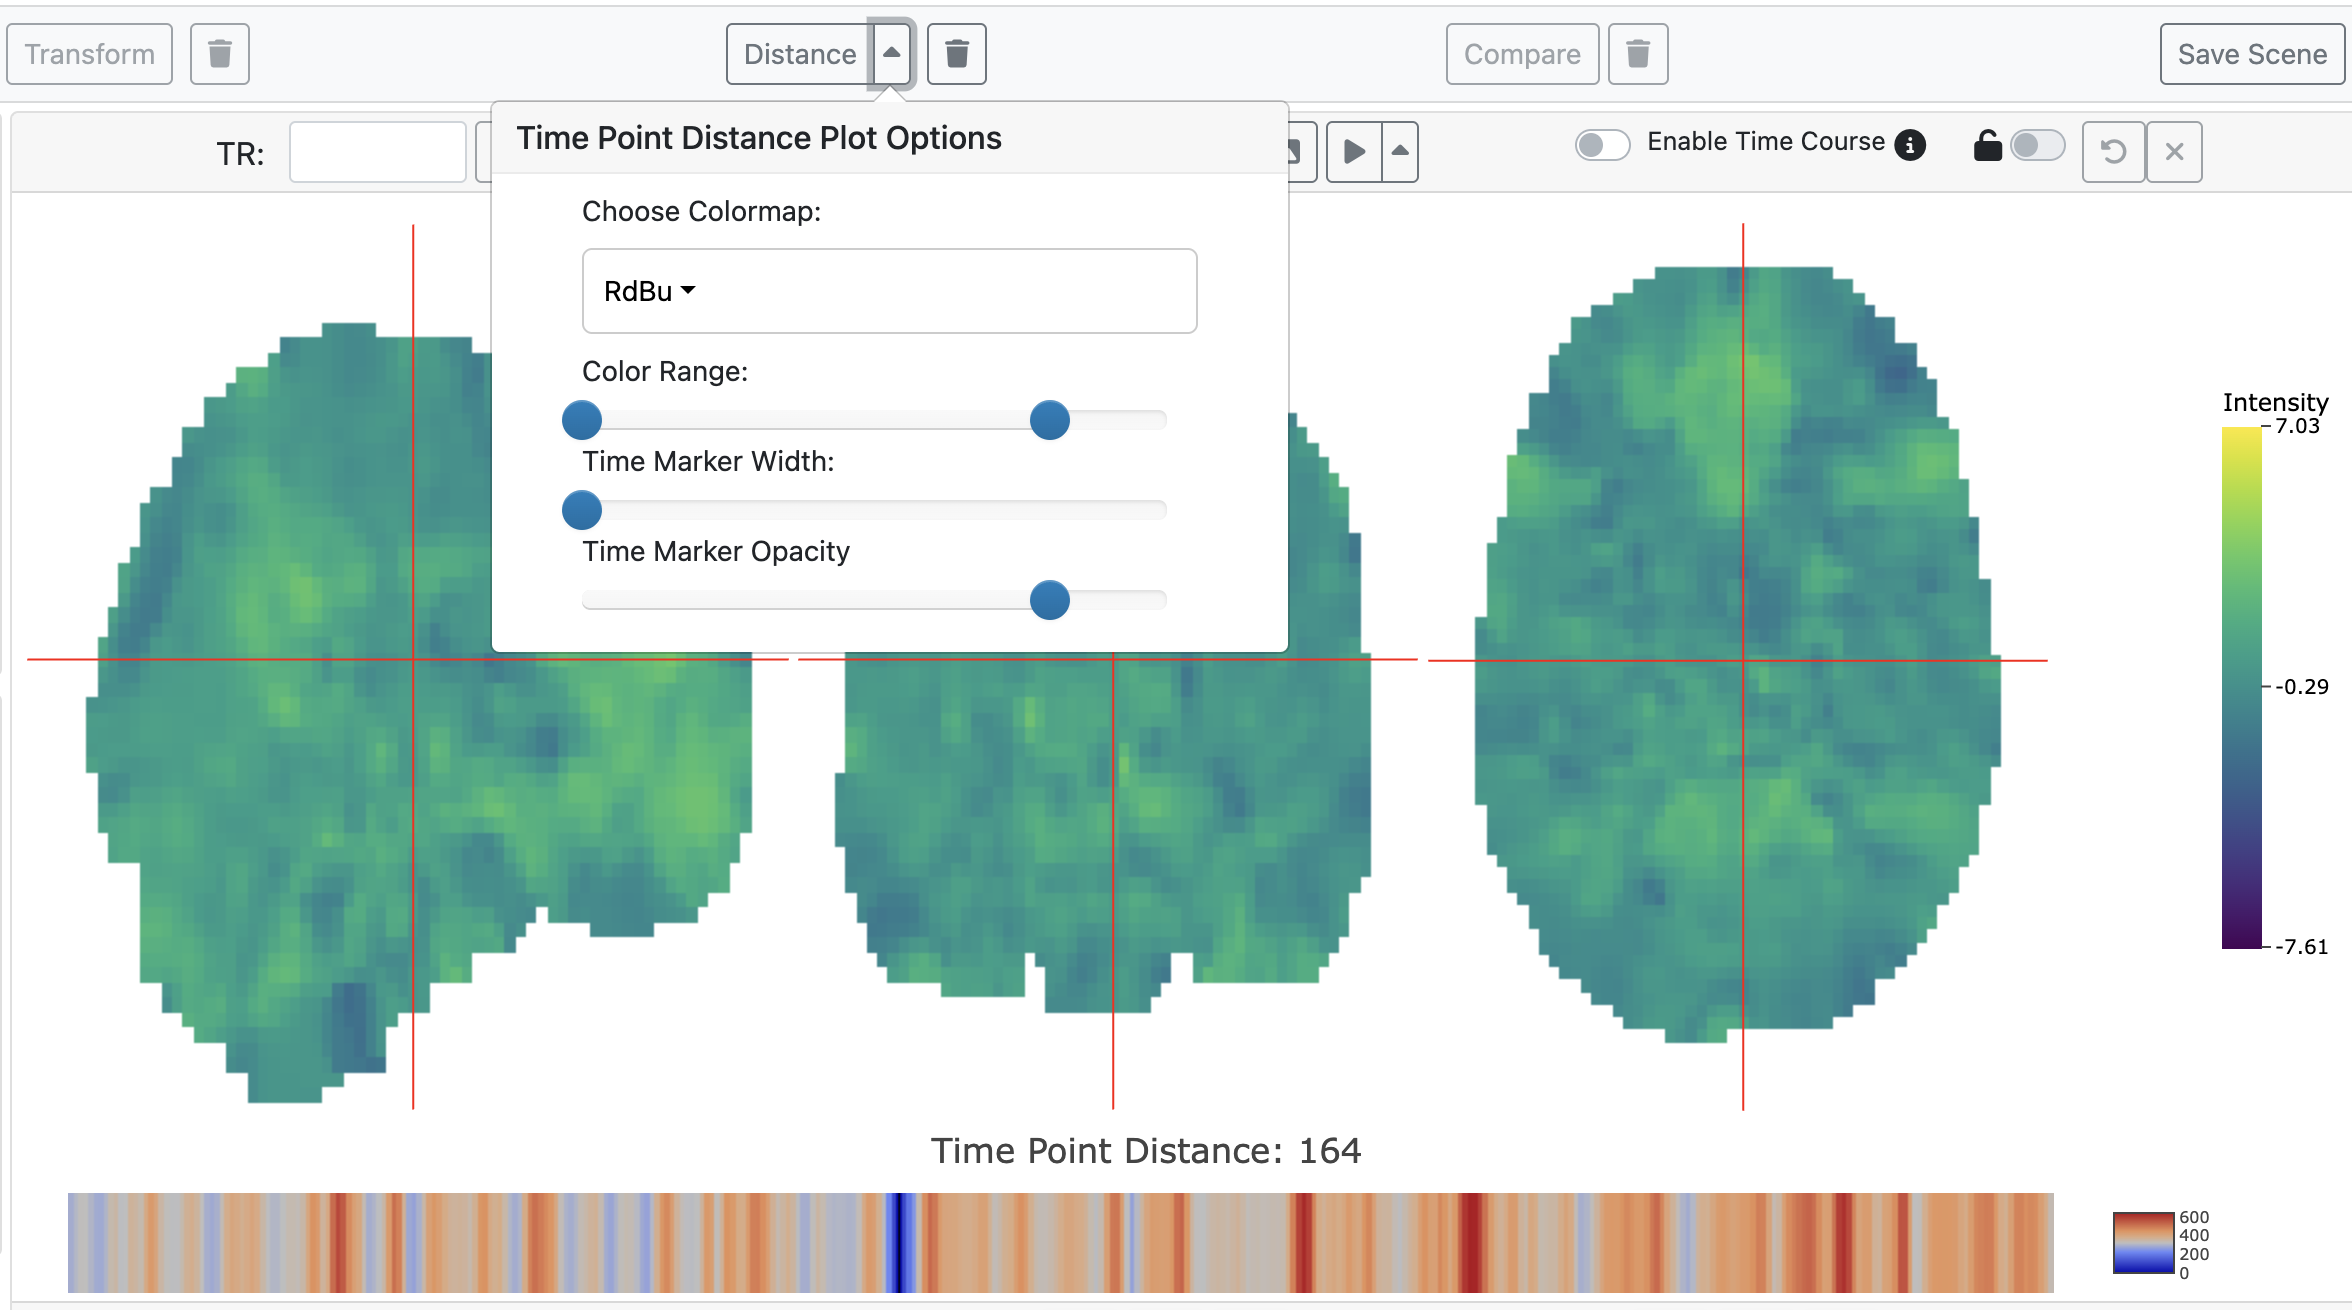
- Choose distance plot colormap
- Modify distance plot color range
- Modify time marker width
- Modify time marker opacity
-
 Clear distance plot
Time Course Correlation Map
Compute a correlation map between an uploaded time course, task design time course, or seed voxel/vertex time course with each voxel/vertex in your fMRI data.
Steps
Select a timecourse (uploaded time course, task design time course, or seed voxel/vertex time course). See the fMRI time course plotting tool for extracting a seed voxel/vertex time course.
Input negative or positive lags into the correlation interface to see correlation maps at lags of the time course.
After completion of the correlation map computation, the correlation map(s) will appear in new window with a new FINDVIZ fMRI plot interface (ensure that pop-ups are not blocked).
Windowed Average
Compute windowed average around selected time points.
Steps
Annotate time points in the time course plot manually (or automatically with the peak finding algorithm.)
Specify the size of the window using negative and positive edge values (specified in time points).
After completion of the windowed average computation, the windowed average fMRI map will appear in new window with a new FINDVIZ fMRI plot interface (ensure that pop-ups are not blocked).
Limitations
Key Points to Remember
- Brain Mask: For NIFTI data, a brain mask is required for all analysis tools. If you didn't upload a mask, all analysis options are disabled.