Navigation Guide
Overview
This guide will help you navigate through the FINDVIZ interface and understand how to interact with the various visualization and control components.
Table of Contents
- FMRI Interface Layout
- FMRI Interface Components
- Timecourse Interface Layout
- Timecourse Interface Components
- Save and Load State
FMRI Interface Layout
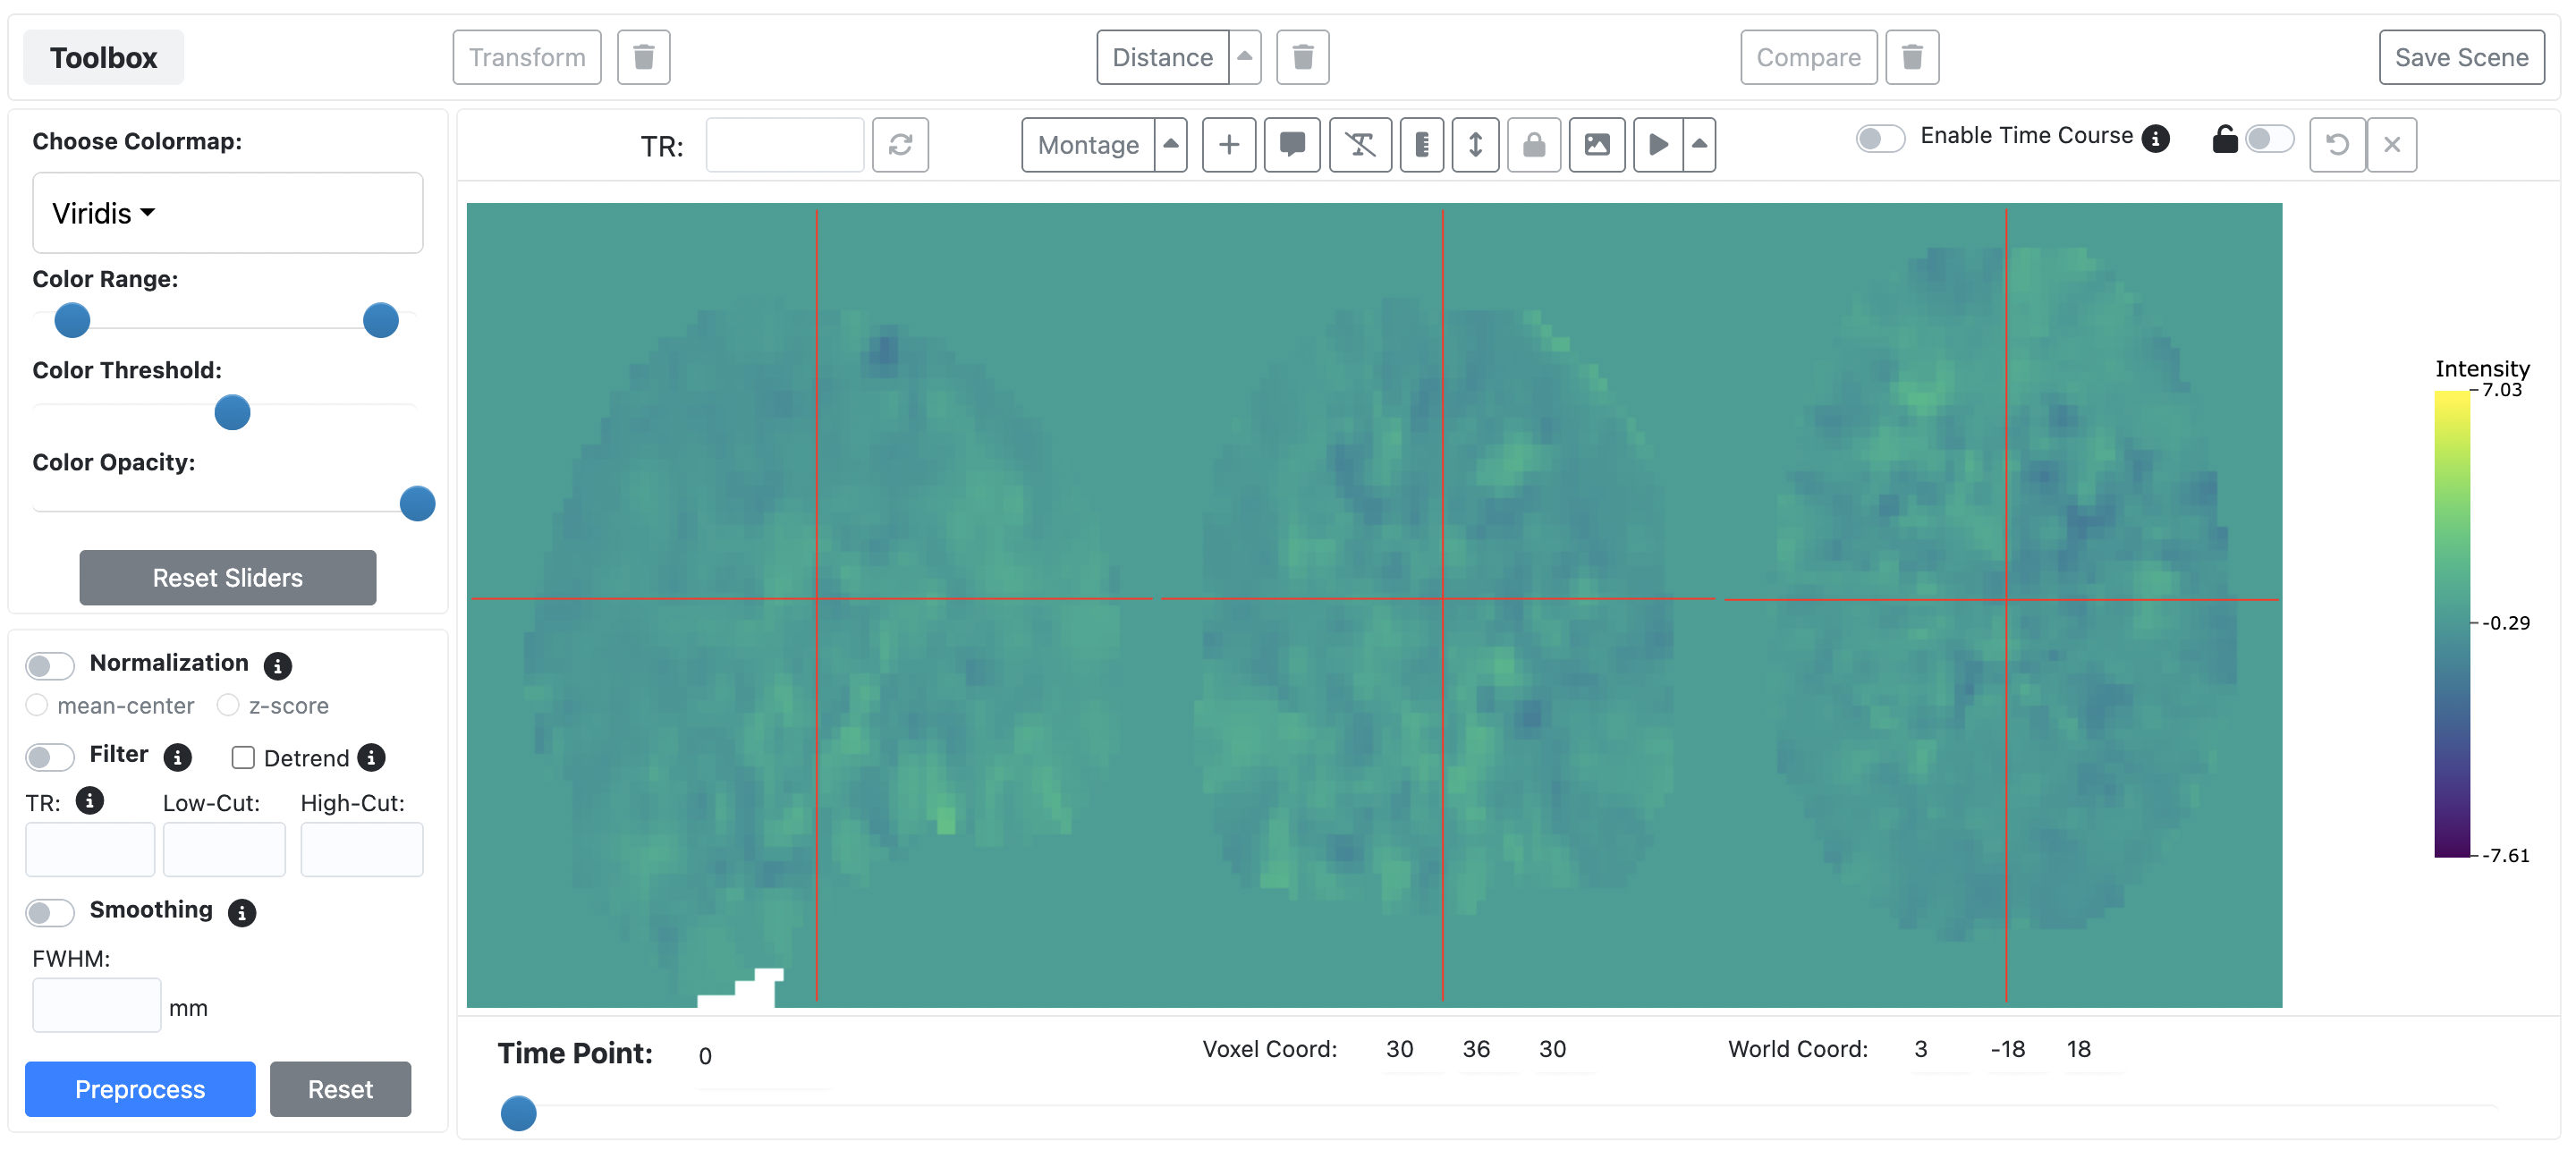
FMRI Interface Components
Toolbox

The toolbox component provides analysis functions to facilitate visualization and discovery of patterns in your fMRI data. Available functions:
- Transform Data Coming Soon: this feature provides common dimension-reduction analyses (PCA, ICA) to be performed on your data
- Time Point Distance: compute the whole-brain distance between the selected time point and all other time points.
- Comparison Coming Soon: this feature provides a means to upload fMRI maps (in the same space and voxel dimensions as your fMRI data) and quantitatively compare the similarity to time points in your fMRI data.
FMRI Color Options
The colormap selector and sliders allow you to customize the coloring of your plot
Color Map Selection
Color Sliders
FMRI Preprocessing
Available FMRI Preprocessing Methods:
- Linear Detrending
- Time Course Normalization (applied to each voxel/vertex time course)
- Temporal Filtering (Band-pass, low-pass, high-pass) specified in hertz (Hz).
-
Spatial Smoothing for Nifti Files
Surface smoothing for CIFTI/GIFTI images is not supported
Plot Options Toolbar

FINDVIZ offers several display tools to manipulate the information displayed in the plot
-
Convert Time Point Display To Seconds based on TR
 This will also update the x-axis labels in the time course plot (see below).
 -
Toggle between Orthogonal and Montage Views (for Nifti images)
 Only 3 slices are supported in montage view
 -
Other plot options
-
 Crosshair toggle (NIFTI)
-
 Plotly hoverbox toggle
-
 Hide/Display direction markers (NIFTI; e.g Anterior-Posterior)
-
 Hide/Display color bar
-
 Reverse colormap
-
 Freeze/lock surface view to current position (CIFTI/GIFTI)
-
 Screen capture (screenshot of current fMRI plot)
-
 Play movie (cycle through timepoints)
-
Plot FMRI Time Courses

FINDVIZ allows plotting of voxel/fMRI fMRI time courses of selected voxels/vertices
Plotting fMRI time courses
Locking Time Course Selections
-
 Remove most recent time course selection
-
 Remove all time course selections
Remove selected time courses
Timecourse Interface Layout
Timecourse Interface Components
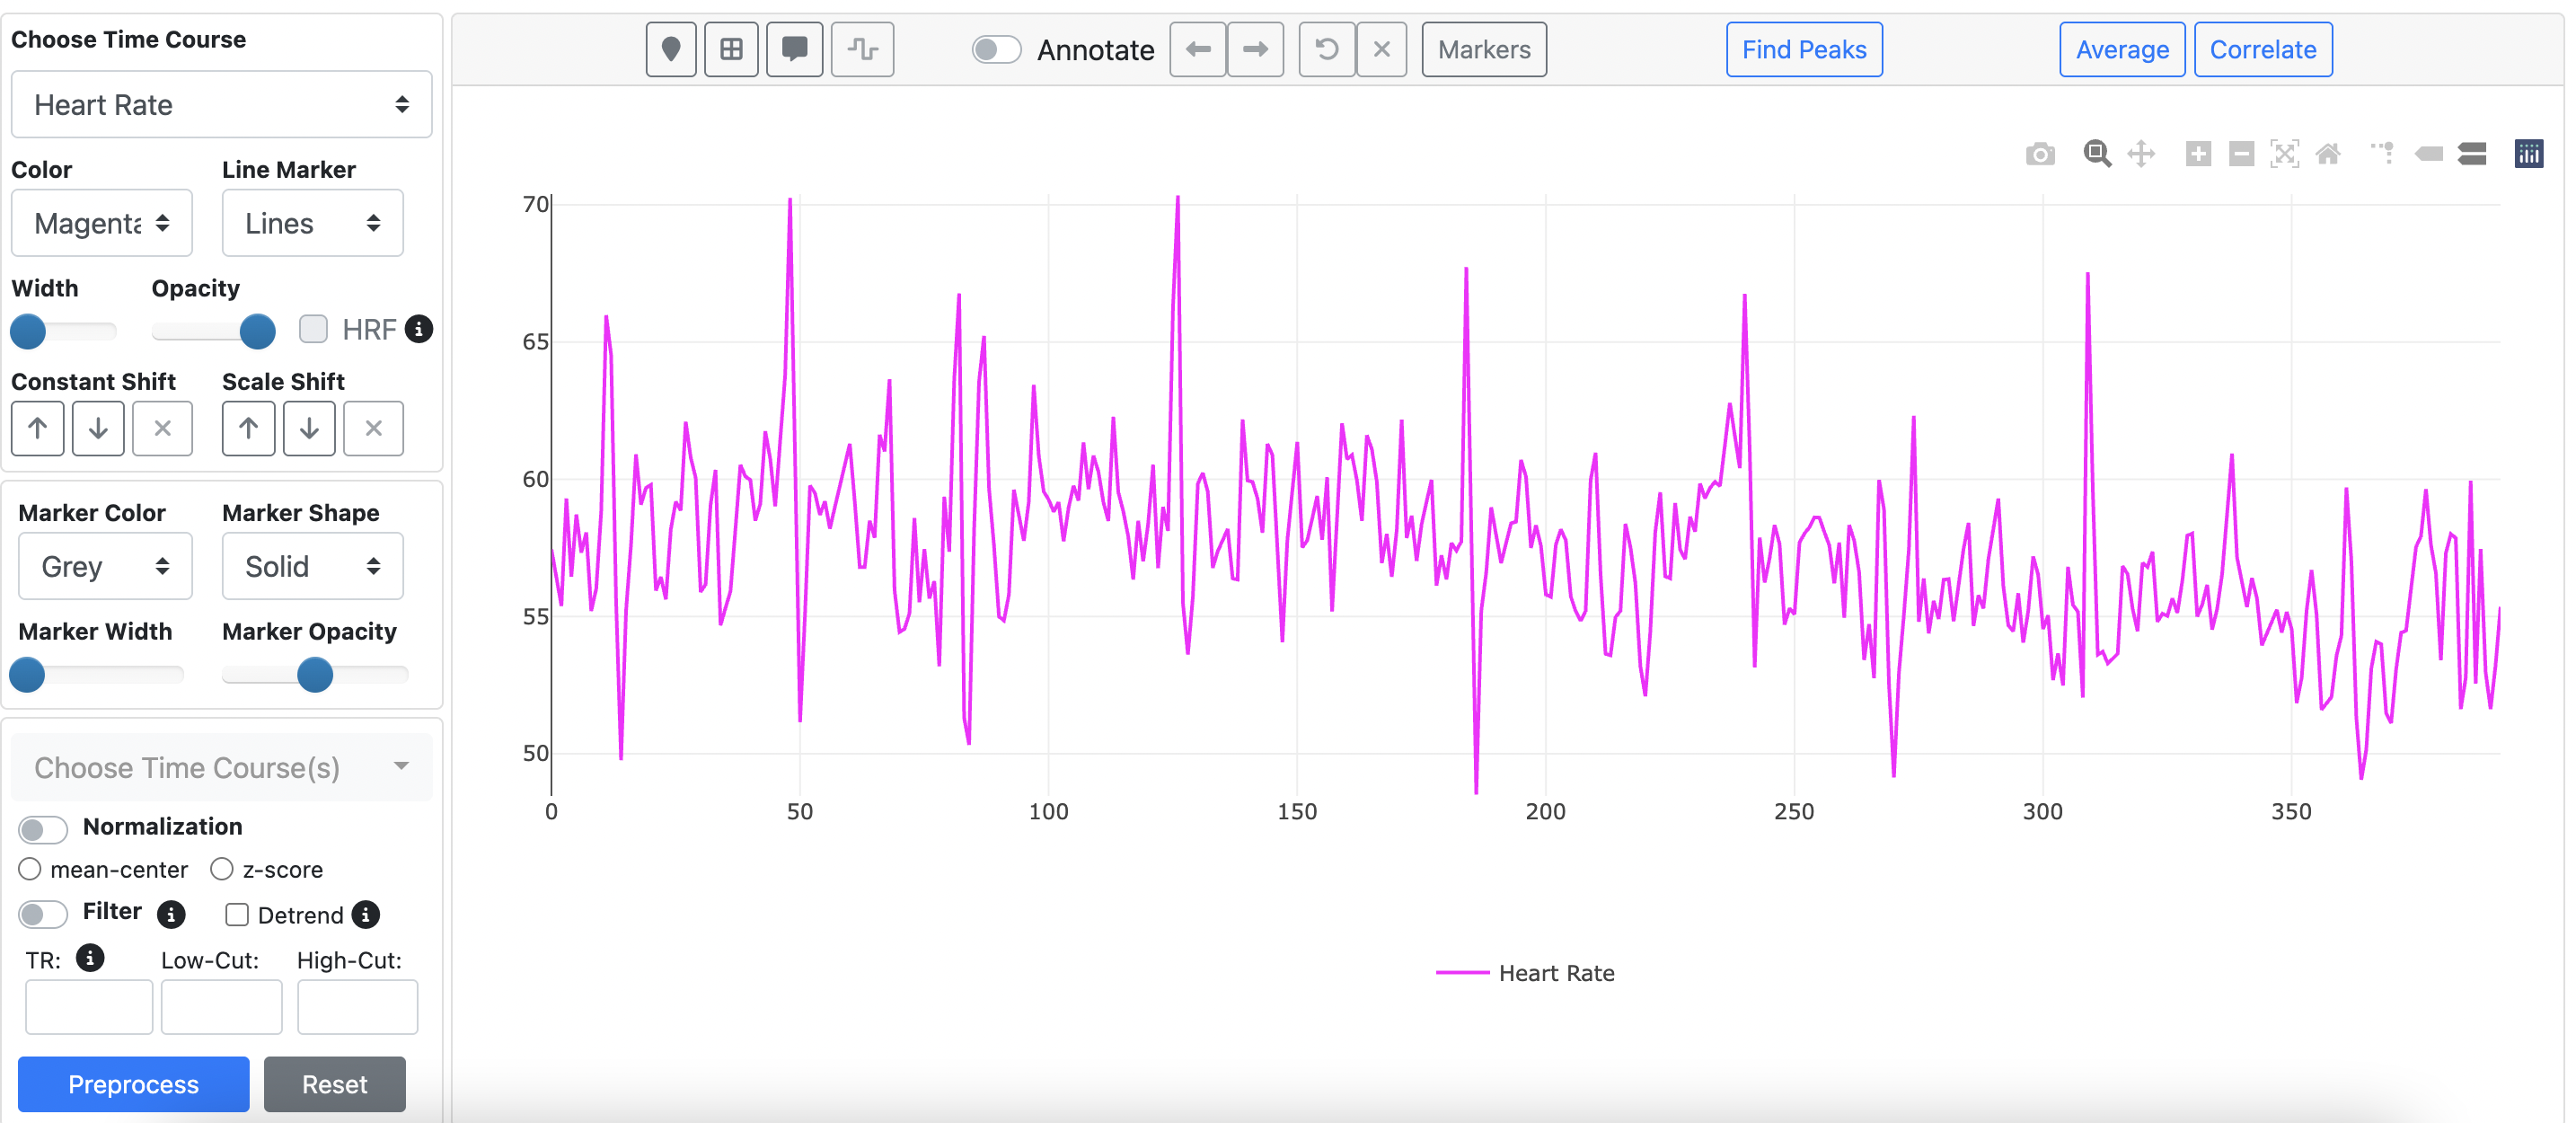
Timecourse Plot Options
Time Course Plot Options
Constant and Scale Shifts
- Constant shift: increase/decrease the baseline of the time course via a constant shift
- Scale shift: increase/decrease the scale of the time course via a scale shift (constant remains the same through scale change)
Task Convolution
Toggle between convolved (canonical HRF) and block task design time courses
-
 Toggle convolution for all task design time courses
Time Marker Plot Options
Timecourse Preprocessing
Available Time Course Preprocessing Methods:
- Linear Detrending
- Time Course Normalization
- Temporal Filtering (Band-pass, low-pass, high-pass) specified in Hertz (Hz).
Timecourse Annotation

Annotate the time course plot with time points of interest and navigate through them by clicking the 'annotation' switch.
Enabling Annotation
The currently selected annotation marker is marked by a highlight around the marker. Click the left and right arrows to move the selected marker left or right.
Removing Annotations
-
Remove most recent annotation
-
Remove all annotations
Marker Plot Options
Modify the plot properties through the marker pop over
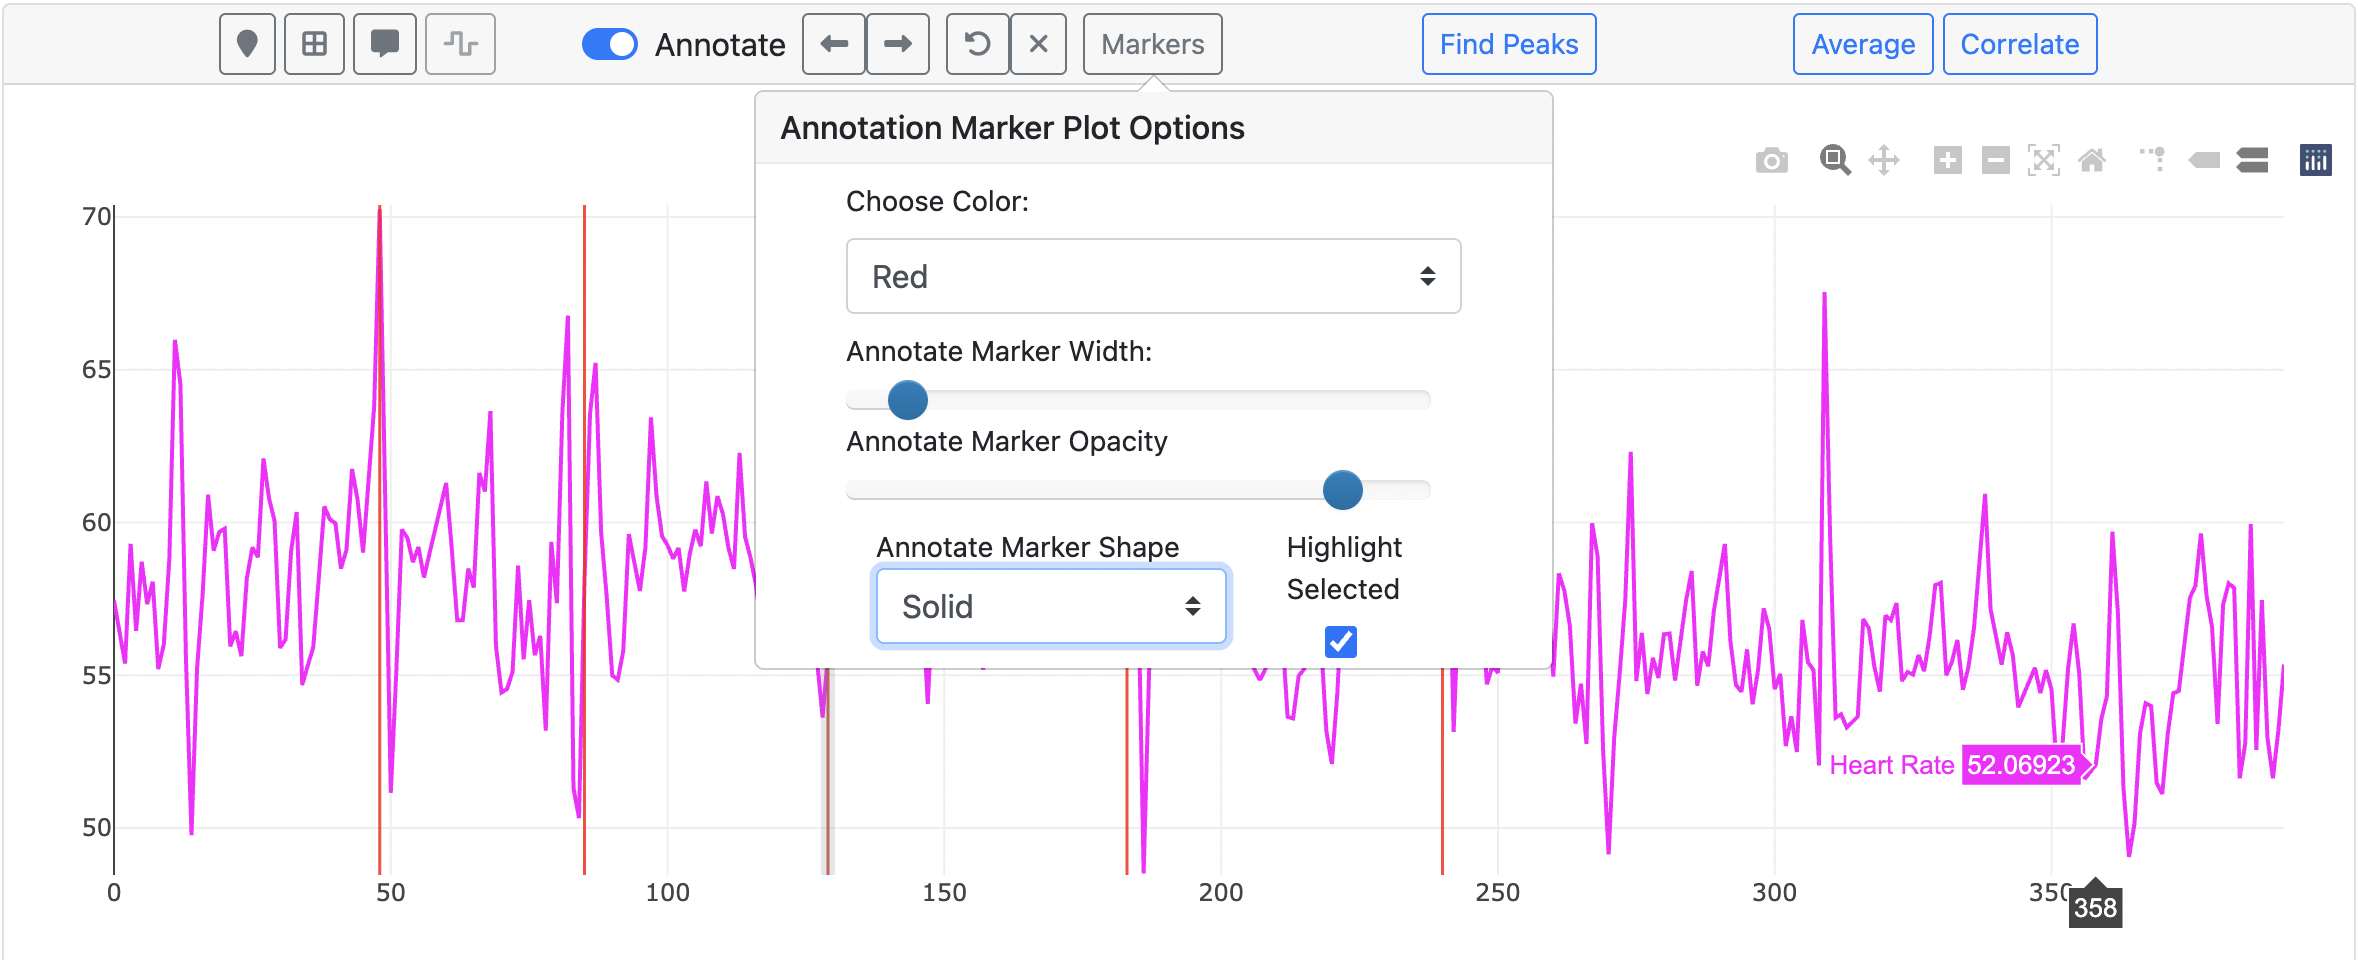
Marking Time Point Peaks
Find peaks in your time course via a local maxima detection algorithm. Hover over the tooltips for information about each parameter.
Developer Note
FINDVIZ uses the SciPy (v1.13.1) find_peaks algorithm for peak detection. For algorithm details, please refer to the documentation.
Save and Load State
Save Scene Function
The Save Scene function allows you to save your current visualization state, including all applied transformations and analysis results, for later use.
How to Save a Scene
- Enter a name for the scene (optional)
- Click Save to download the scene file